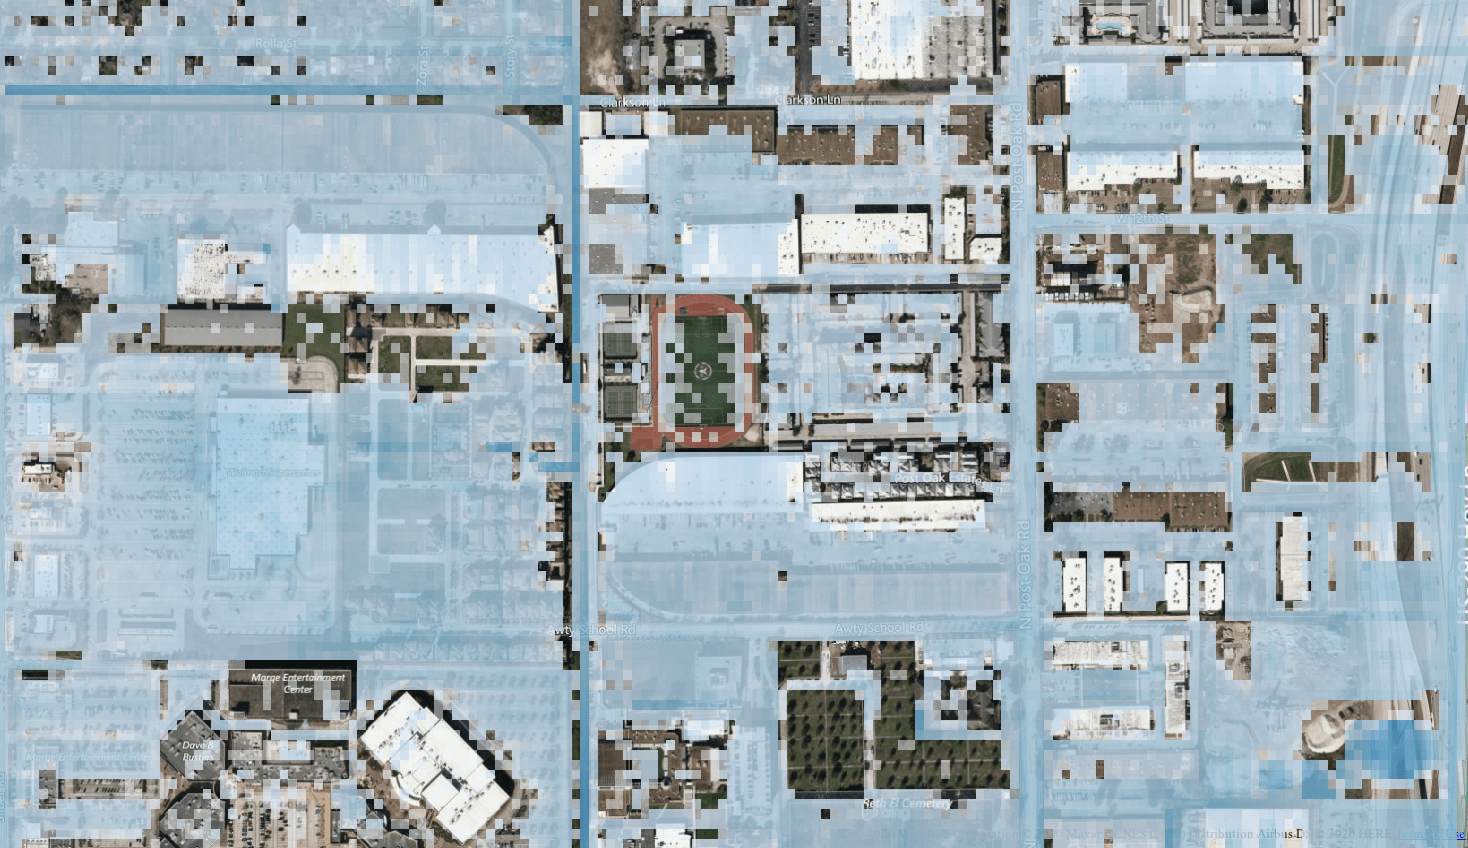
Traditional catastrophe risk models have always assessed the risk to a building using a single latitude/longitude point. For lower resolution hazards such as wind, this approach works very well as the horizontal resolution is on the order of hundreds of meters and is not highly variable. This means that a large building will likely experience the same risk over the entire footprint. The KatRisk flood model is, however, at much higher resolution (10 meters) and is highly variable. For this type of hazard, modelling a building using a single location can over or under estimate the hazard.
To address this issue, KatRisk has added its “Spatial Footprint Module” to both its SoloKat and SpatialKat software product suites. This module allows the user to import several parameters that define the shape of a building either as a rectangle/ellipse, or as a more complicated polygon structure. Additionally, users may also decide how they want to evaluate hazard over the entire footprint by either taking the min/mean/max hazard, or by computing an equivalent single flood depth by combining mean damage ratios underneath the footprint.
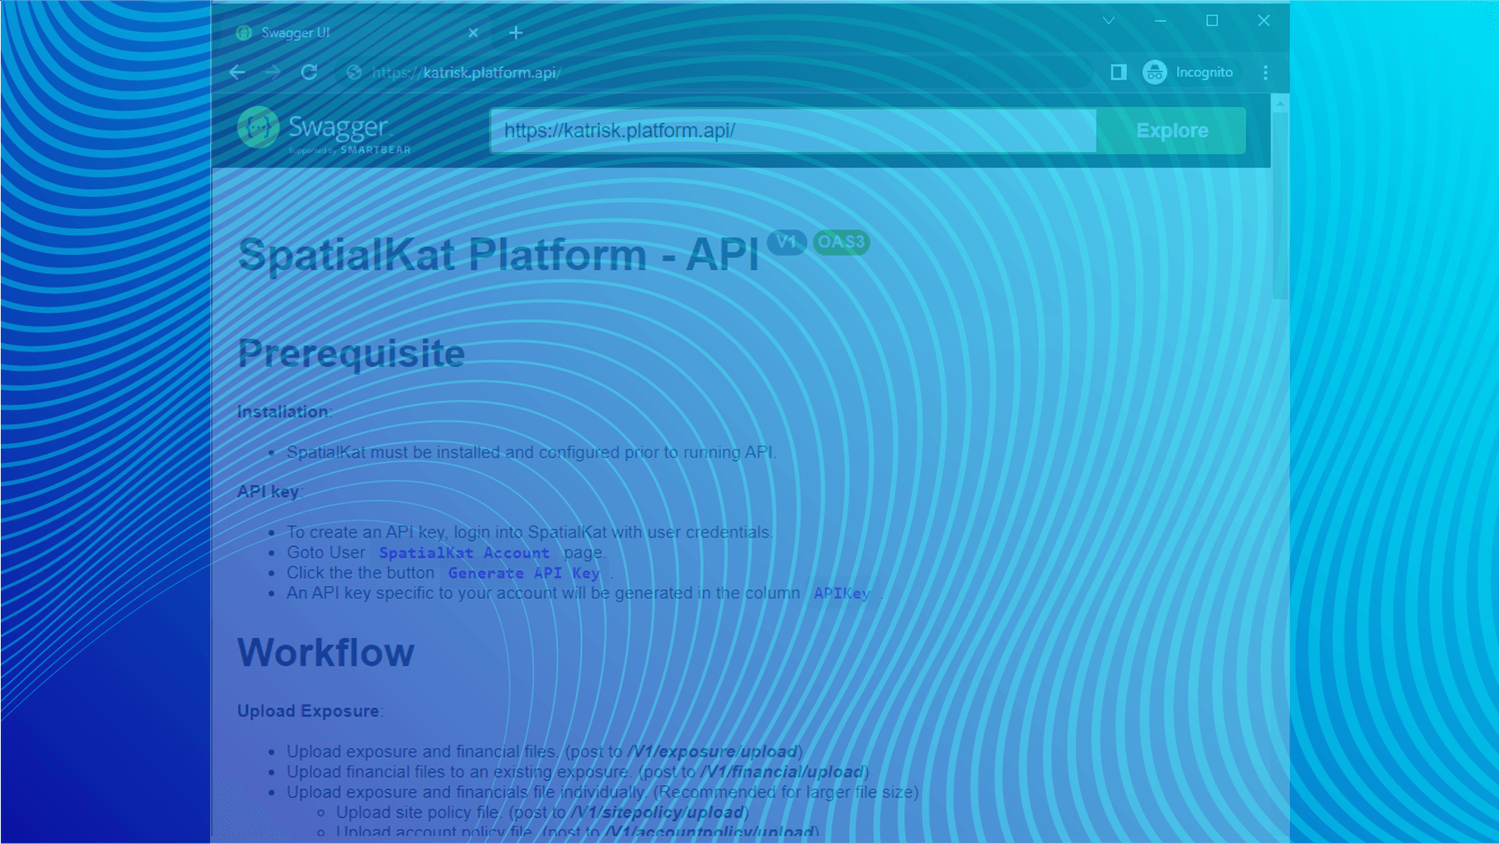
For those clients using the KatRisk API to quantify flood risk in their underwriting process, hazard, score and loss results for a location can be returned in one second. This speed is imperative for embedding KatRisk information within a quoting process workflow. In order to model spatial footprints within the API, multiple latitude/longitude pairs can be submitted for an individual location with hazard and loss results returned for each coordinate pair. The multiple results can then be summarized (e.g. averaged, maximum, average of top x% of points) based on client preference. Even if the exact dimensions of buildings are not known, it is typically possible to specify offsets from the geocoded points based on occupancy.
The below two figures show a set of locations using either the simple rectangle/ellipses and more complex hand-drawn polygons of the same locations.

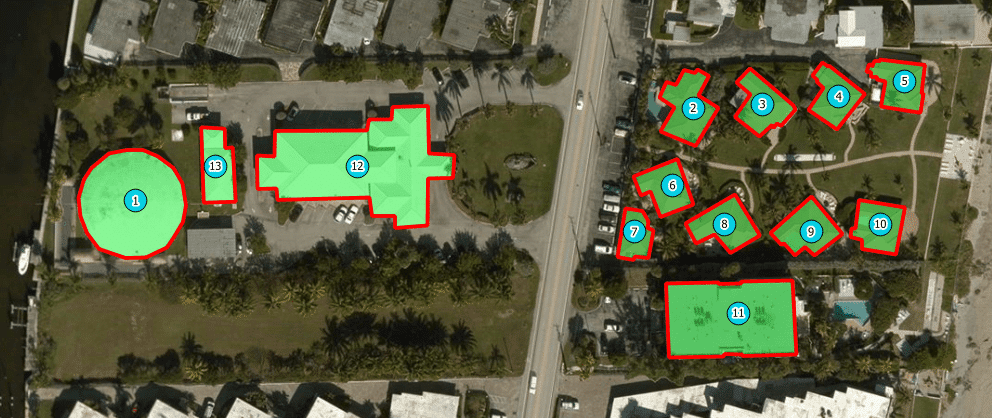
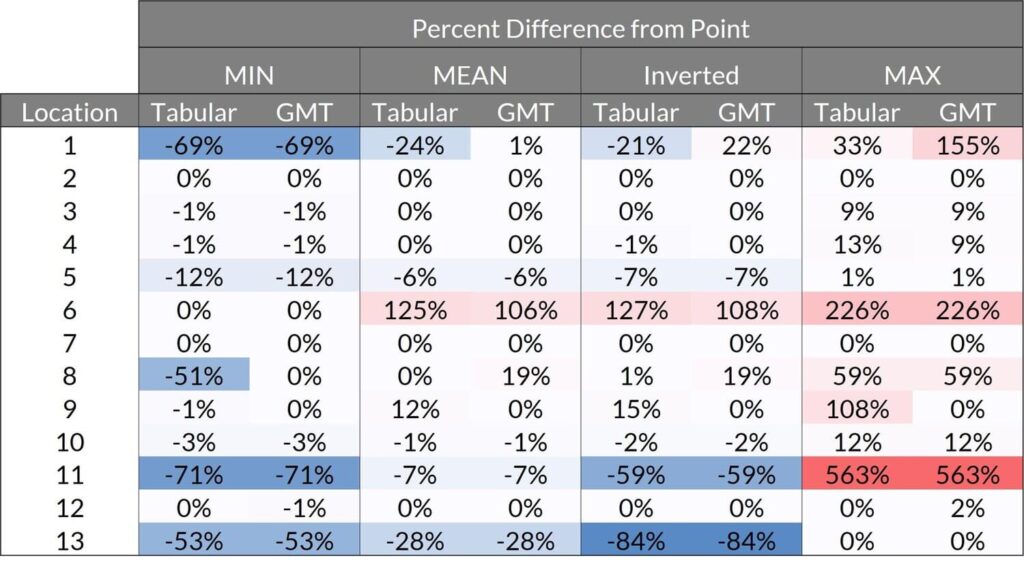
The below table shows the effect on average annual loss for each of the above mentioned locations if they are modeled as a single lat/long point, as a rectangle/ellipse (noted as “tabular”), or as a polygon (noted as “GMT”).
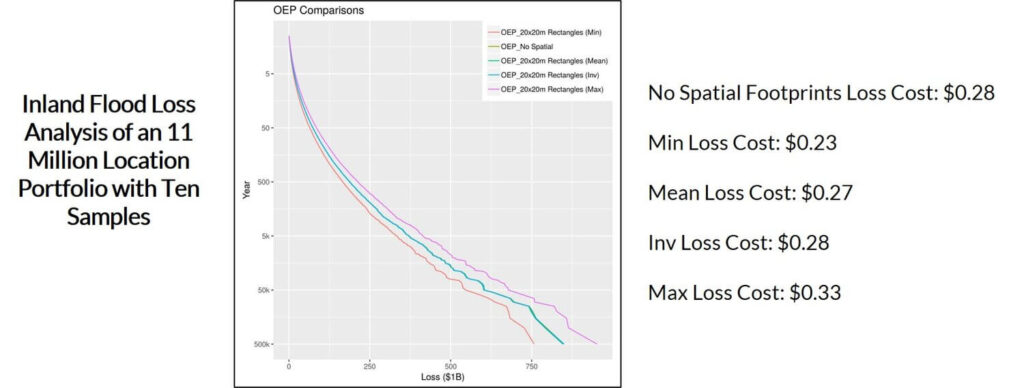
While the effects at the location level are important, portfolio level losses are also of interest. The below figure compares the loss statistics for an 11 million location residential portfolio where each building is defined as a 20 by 20 meter rectangle.
